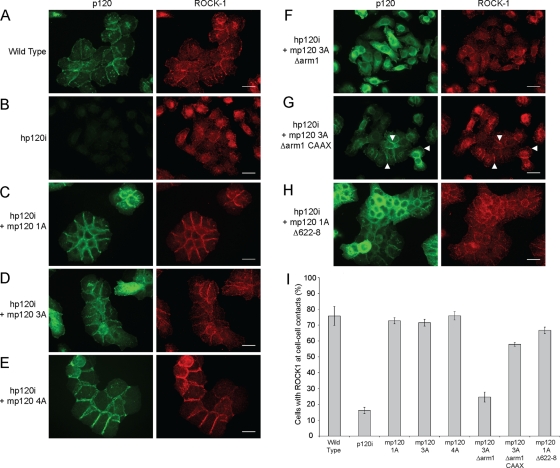
FIGURE 6:
p120 regulates ROCK1 localization at cell–cell junctions. Immunofluorescence analysis of endogenous ROCK1 in wild-type A431 cells (A), hp120i A431 cells (B), or hp120i cells expressing (C) mp120 1A, (D) mp120 3A, (E) mp120 4A, (F) mp120 3A Δarm1, (G) mp120 3A Δarm1 CAAX, or (H) mp120 1A Δ622-8. Scale bars: 10 μm. (I) Quantification of ROCK1 localization at cell–cell contacts in the analyzed A431 cells lines. Bars represent the average percentage of cells in four 20× fields with ROCK1 localized to cell–cell contacts. Error bars represent SE of the mean.

