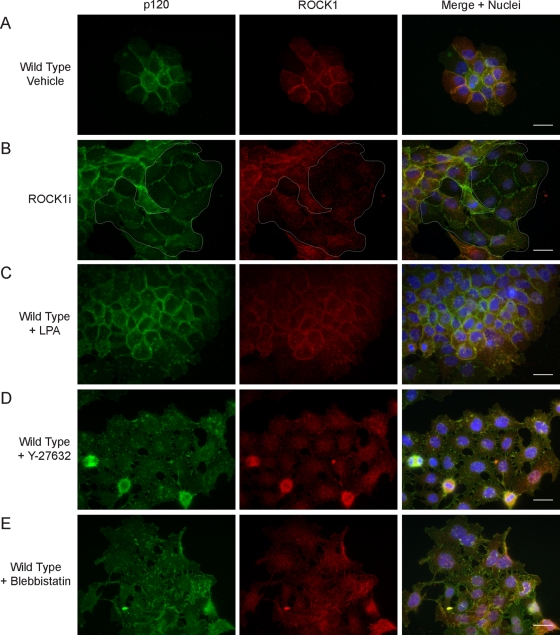
FIGURE 8:
Inhibition, but not activation, of ROCK activity mimics the effects of ROCK1 depletion. Immunofluorescence analysis p120 (green) and ROCK1 (red) of vehicle-treated wild-type A431 cells (A), A431 cells expressing ROCK1 shRNA, outlined in white (B), and wild-type A431 cells treated with 5 μM LPA (C), 10 μM Y-27632 (D), or 10 μM blebbistatin (E) for 24 h. Scale bar: 10 μm.

