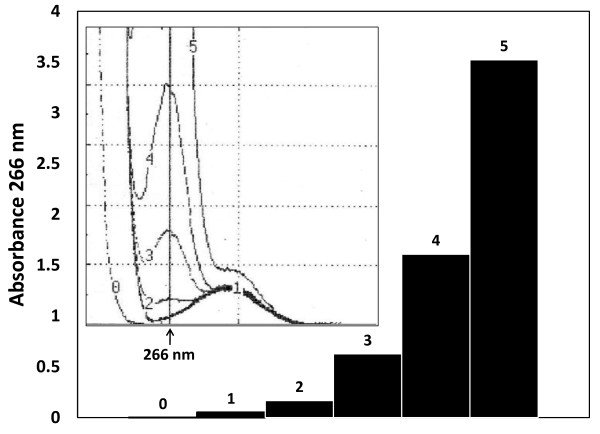
Figure 1.
Spectral scans and the kinetic of aldol-protein formation with respect to the time. At the internal graph, aldehyde condensation of acrolein in the presence of albumin at alkaline pH proceeds from 0 to 50 minutes (number 0-5 on the line), making grow the absorbance denoted by ascending peaks at 266 nm. One more peak, corresponding to protein absorbance is showing around 280 nm but this time without apparent time dependent changes. At right side the bars denoting the exponential behave corresponding to the protein-aldehyde condensation kinetic. The data depicted correspond to one of the curves obtained using the described experimental conditions such as was explained in material and method section.

