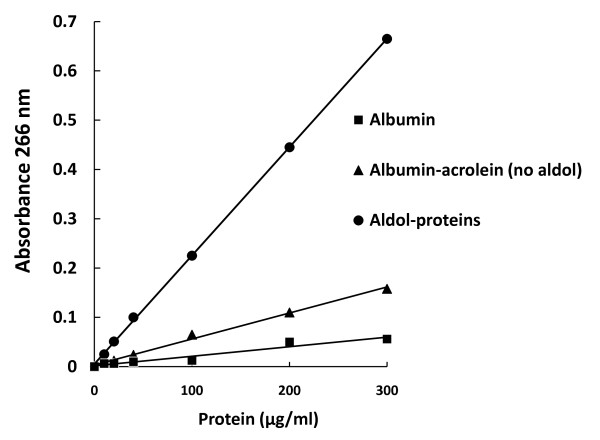
Figure 2.
Standard curve representing the linear relationship between the protein-acrolein adduct concentration and the absorbance at 266 nm (Aldol-Proteins). Parallel standard curves were made with only albumin and albumin plus acrolein without the addition of sodium hydroxide (Albumin and Albumin-acrolein no aldol). The standard curves performed in this way correspond to the values of the intrinsic absorbance of albumin (and albumin-acrolein no aldol) around the 280 nm. Samples for the standard curves were prepared as described in Material and Methods Standard preparation section. The absorbance of each aliquot was read against a blank of only guanidine hydrochloride 6M. Data depicted correspond to one of the standard curves obtained.

