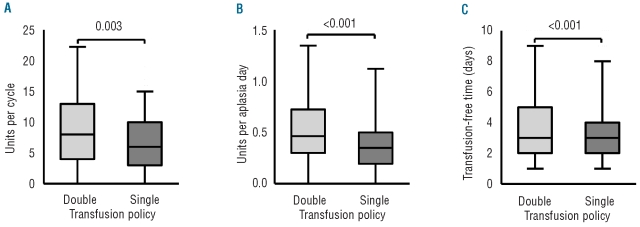
Figure 1.
Reduction of RBC units per therapy and transfusion-free time. The box plots display medians, interquartile ranges, and 95% confidence intervals. The double RBC-unit period is represented in light gray and the single-unit period in dark gray. (A) Changing the transfusion policy led to a 25% reduction of the transfused RBC units per therapy cycle (P=0.003). (B) Normalization to one aplasia day resulted in a 24% reduction of the RBC transfusions in the single-unit period (P<0.001). (C) The mean time between two transfusions was 20% longer in the double-unit period (P<0.001).

