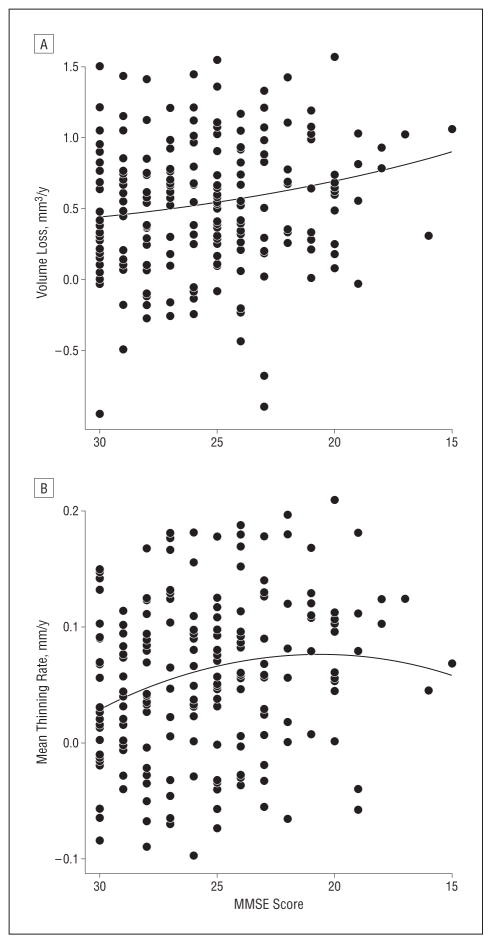
Figure 4.
Best second-order polynomial fit for Alzheimer disease (AD)–specific cortical thinning rates and hippocampal volume loss rates as functions of Mini-Mental State Examination (MMSE) score. Shown are scatterplots of rates of AD-specific hippocampal volume loss (A) and cortical thinning (B) vs MMSE score. Each dot represents an individual with an AD-like cerebrospinal fluid molecular profile. The curves represent best-fit quadratic functions. The curve for the hippocampus is approximately linear (but slightly convex due to a nonsignificant positive coefficient in the quadratic term). The curve for AD-specific cortical thinning is concave, with an optimum at approximately the MMSE score of 21. To examine the sensitivity of the fit to outliers, we reanalyzed these data without the 2 individuals with extreme data, namely, those with MMSE scores of 16 and 15, respectively. All results remained approximately the same. Crucially, the quadratic term for AD-specific thinning was statistically significant, and the optimum score was approximately 21.

