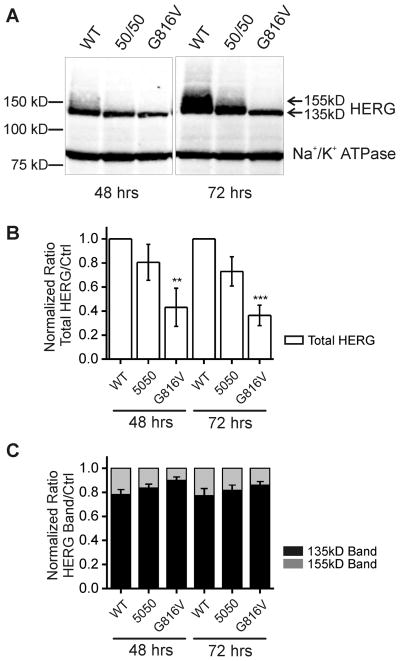
Figure 2. Baseline Protein Expression of G816V HERG compared to WT HERG in HEK 293 cells.
A) Western blot shows whole cell lysate of HEK 293 cells transfected with either WT HERG or G816V HERG plasmid DNA alone or in a 50/50 mix at 48 and 72 hours post-transfection. Antibodies used were against the Myc-tag for both types of HERG and against Na+/K+ ATPase as a loading control. The molecular weight marker appears at left and HERG appears as a doublet of two bands at 135 kDa and 155 kDa (arrows) separated on 7.5% SDS-PAGE. B) Histogram showing summary data of total HERG protein expression levels normalized to Na+/K+ ATPase. Graph shows densitometry quantification of total HERG where protein expression of total G816V HERG compared to total WT HERG is reduced both at 48 and 72 hours, n=5 with ** p-value < 0.01 and ***p-value < 0.001. C) Histogram showing the distribution of 135 kD and 155 kD HERG bands for wild-type, 50–50 mix and G816V with totals normalized to 1.

