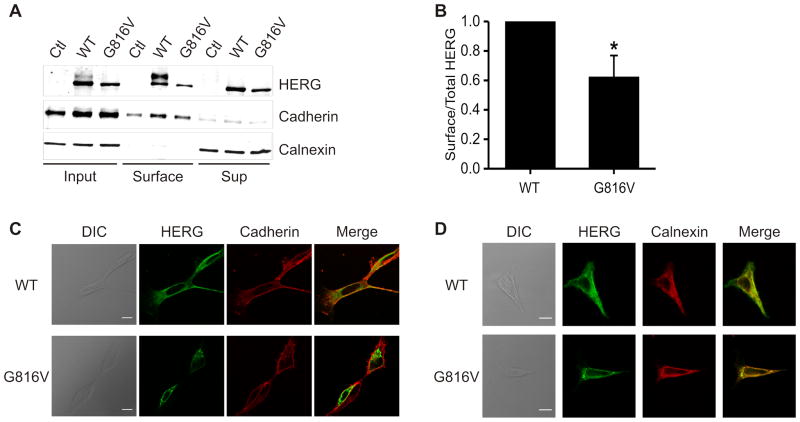
Figure 4. Cell Surface Expression of G816V HERG compared to WT HERG.
A) Immunoblot of cell surface proteins which were isolated by biotin labeling and pull-down from transiently transfected HEK cells. Samples were separated by 7.5% linear SDS-PAGE. Calnexin was the negative control for surface labeling and cadherin was the positive control for surface labeling in the lower panels. Western blot was performed with anti-HERG, anti-calnexin, and anti-cadherin antibodies. B) Summary data for part A. Densitometry analysis of the surface expression of HERG proteins was quantified as the amount of surface HERG divided by the total cellular HERG and also normalized for streptavidin pull-down of biotinylated protein (normalization calculated using cadherin and calnexin controls). WT HERG is normalized to 1.0. n=4, * p<0.05. C) Confocal immunofluorescence micrographs of HEK 293 cells transfected with either WT HERG or G816V HERG and counter-stained with anti-cadherin antibody to indicate the cell membrane. Pearson correlation of HERG and cadherin colocalization is 0.571±0.025 for WT HERG and 0.332±0.029 for G816V, p<0.001. n=15, scale bar=10 μm, DIC = differential interference contrast. D) Confocal immunofluorescence micrographs of HEK 293 cells transfected with either HERG-WT or HERG-G816V and counter-stained with anti-calnexin antibody to indicate the ER, an intracellular compartment. Pearson correlation of HERG and calnexin colocalization is 0.831±0.026 for WT HERG and 0.916±0.006 for G816V, p<0.01. n=13, scale bar=10 μm.

