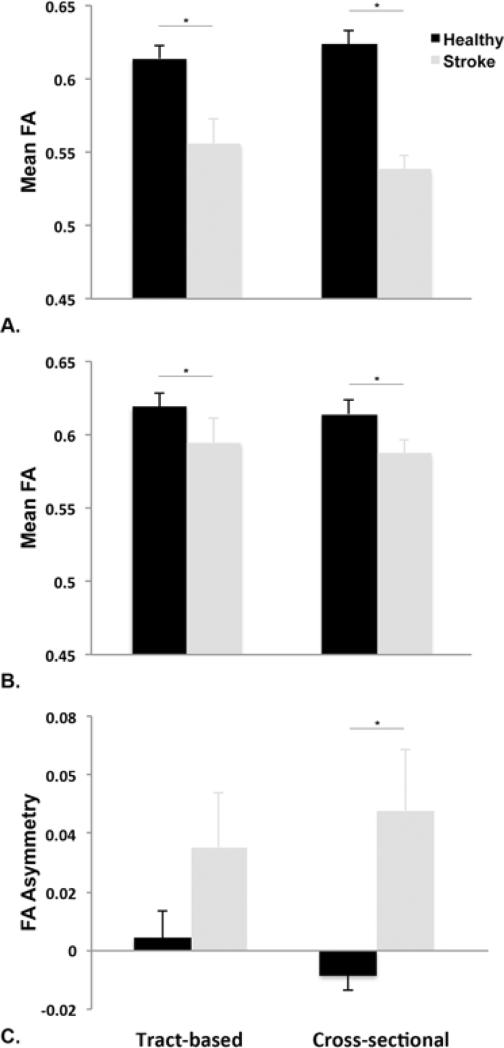
Figure 4. Mean FA and FA asymmetry values between participants with stroke and healthy individuals.
A. Ipsilesional mean FA was significantly lower in the stroke group compared to healthy individuals using either tract-based or cross-sectional approach. B. Contralesional mean FA was also lower in the stroke group compared to healthy controls for both approaches. C. FA asymmetry was significantly higher in the stroke group, indicating increased tract disruption in the ipsilesional tract compared to the contralesional tract, using the cross-sectional, but not the tract-based, approach. *p<0.05.

