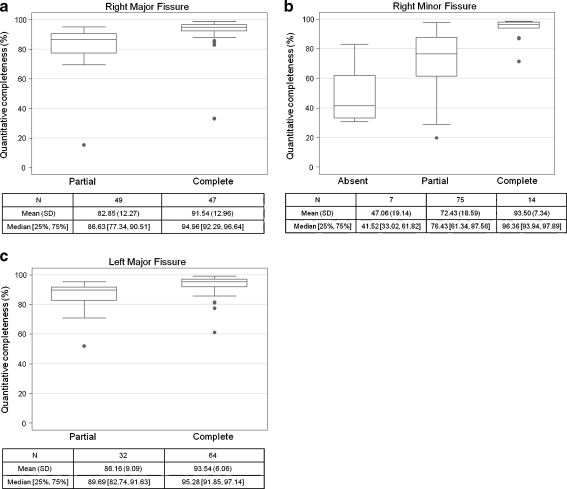
Fig. 4.
a: Box-plots showing the quantitative fissural completeness score for each visually scored category for the right major fissure. b: Box-plots showing the quantitative fissural completeness score for each visually scored category for the right minor fissure. c: Box-plots showing the quantitative fissural completeness score for each visually scored category for the left major fissure

