
Figure 7. Lack of vesicular zinc does not alter the relationship between stimulus strength and Ca2+ release.
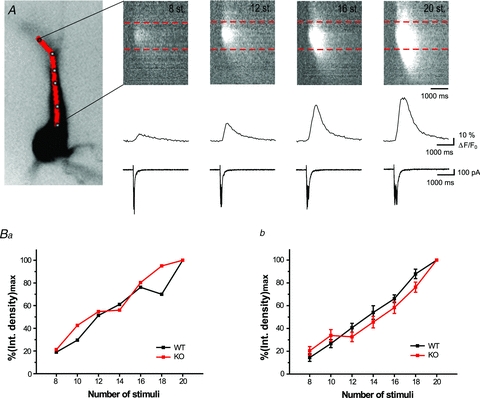
A, Ca2+ signals triggered by 8, 12, 16 and 20 synaptic stimulations (at 100 Hz) and visualized using a pseudo line scan along apical dendrite (continuous red line, left). Corresponding Ca2+ traces and electrophysiological responses are shown at the bottom. Ca2+ signals were averaged within the area of the hot spot indicated by dashed red lines.Ba, plot showing correlation between integrated Ca2+ signals, normalized with the respect to maximum value and the number of synaptic stimuli. Data from an individual cell are shown. Note that in both ZnT3 wild-type and KO mice, linear correlation was observed between the number of stimuli and the amplitude of the Ca2 waves, unlike the data obtained from rats (Fig. 6).Bb, summary plot indicating that Ca2+ signals evoked by different number of synaptic stimuli were not significantly different in ZnT3 KO mice (n = 14) when compared to wild-type animals (n = 9).