
Figure 1. MRS details.
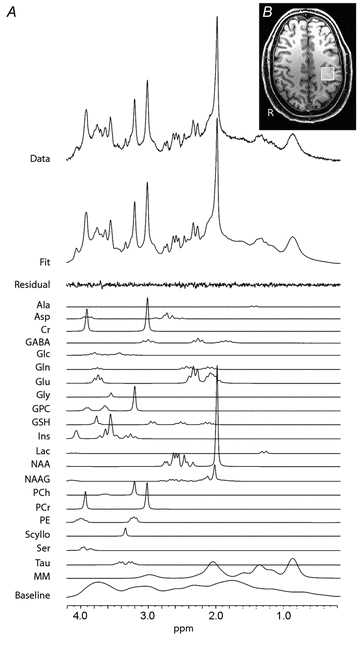
A, typical spectrum acquired using the SPECIAL sequence from the M1 voxel. The original MRS data is shown in the top row. The next row is the full model fit produced from LCModel (Provencher, 1993). The high quality of the fit is demonstrated by the small residual signal remaining after fitting; shown by the row labelled ‘residual’. Individual fits for all neurochemicals are also demonstrated – each neurochemical has multiple fitted peaks that reflect the individual protons within the molecule. GABA is found at a low concentration in the brain, as reflected by the relatively low-amplitude peaks. Despite this low concentration, the high quality of the fit for GABA is demonstrated by Cramér–Rao bands <20%.B, location of the left primary motor cortex (M1) voxel.