
Figure 2. Experiment 1.
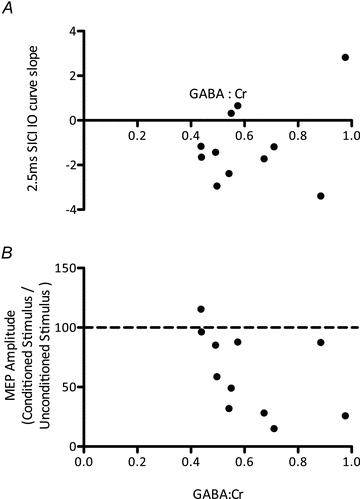
A, no significant relationship between 2.5 ms SICI (higher numbers reflect greater inhibition) and MRS-assessed GABA levels (r = 0.33, P = 0.31).B, no significant relationship between LICI (lower numbers reflect greater inhibition) and MRS-assessed GABA levels (r = –0.47, P = 0.51). Data points reflect individual subjects.