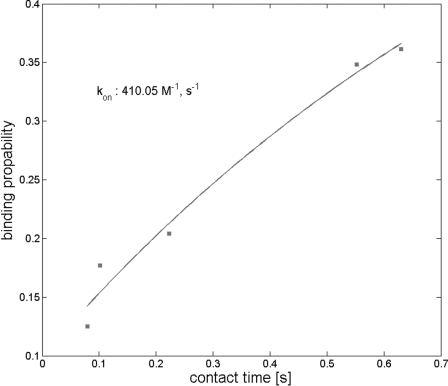
FIGURE 6.
Kinetic on-rate plot. Experiments were done as described in the legend to Fig. 4B. Force approach-and-retraction cycles were recorded of the indicated contact times, and the binding probability was determined from the number of fruitful interactions. This binding probability was plotted as a function of the contact time. The solid line is the result of a least-squares fit of a monoexponential rise.

