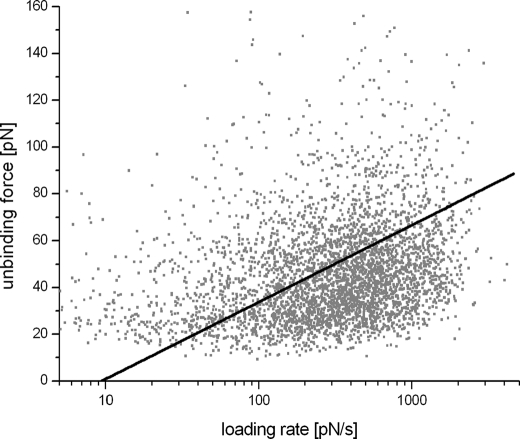
FIGURE 7.
Loading rate of unbinding force. From force curves showing unbinding events the unbinding force Fi was plotted versus the loading rate ri of every individual curve, with the latter being calculated by multiplying the effective spring constant with the pulling speed. The corresponding scatter plot thus shows the rupture force as a function of loading rate for all measured binding events (4624 events). From those data, koff and xβ were determined to be 0.65 ± 0.02 s−1 and 2.88 ± 0.03 nm, respectively. With the kinetic on-rate as determined above to 410.05 m−1 s−1, the dissociation constant KD = koff/kon was calculated to be 1.6 mm.

