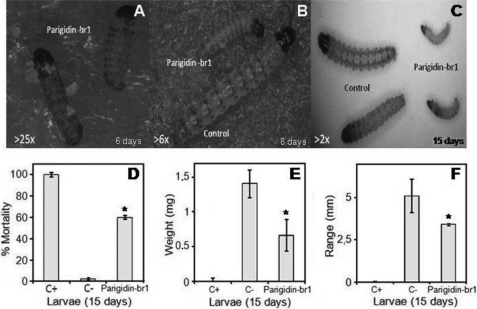
FIGURE 4.
Insect bioassays. Larvae of D. saccharalis were treated on an artificial diet with 1 μm parigidin-br1. A, 25× magnified image of neonate larvae on the sixth day of the experiment. B, 6× magnified image of the eighth day of the experiment. It was possible to observe a difference in development between the treated larvae on diets containing parigidin-br1 (smaller larvae) and those fed on the negative control diet (larger larvae). C, by the 15th day of the experiment, the difference in development of the larvae treated with parigidin-br1 compared with the larvae of the control is very distinct (image magnified 2×). D, larval mortality after 15 days of the feeding trial. E, larval weight variation. F, graphical representation of developing larvae on the 15th day of the experiment. The positive control in these experiments was a Cry1aC protein diet (200 μg·ml−1), and the negative control was a water diet. The asterisk represents a statistical evaluation carried out using a Welch two Sample t test, giving a confidence interval of 95%, p value = 3.172e-07, p < 0.01. Error bars represent S.D. Each assay was performed in triplicate.

