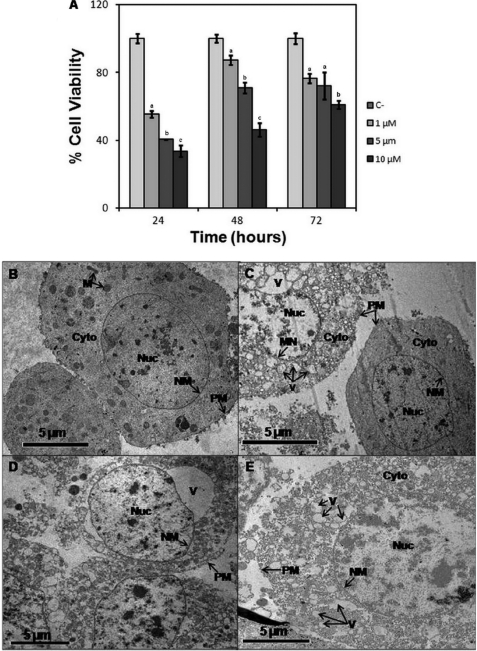
FIGURE 5.
Analysis of the in vitro effects and images of transmission electronic microscopy of SF-9 ovary cells treated with different concentrations of parigidin-br1 performed over 72 h. A, cytotoxic activity of parigidin-br1 over SF-9 cells analyzed at 24, 48, and 72 h. B, negative control SF-9 cells. C, cells treated with 1 μm parigidin-br1. D, cells treated with 5 μm parigidin-br1. E, cells treated with 10 μm parigidin-br1. Labels and arrows indicate the mitochondria (M), cytoplasm (Cyto), nuclei (Nuc), nuclear membrane (NM), plasma membrane (PM), and vacuole (V). Error bars represent S.D. Each assay was performed in triplicate. At each time of evaluation, significant differences are indicated by different letters Tukey (p ≤ 0.05).

