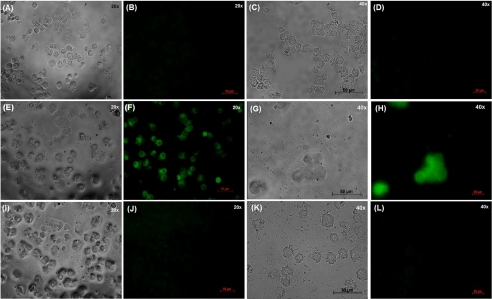
FIGURE 6.
Fluorescence micrographs showing parigidin-br1-FITC (10 μm) binding in SF9 cells membranes. A and C, shown is a light microscopy of SF-9 cells at 3 h and 24 h, respectively. B and D, shown is a fluorescence microscopy of SF-9 cells at 3 h and 24 h, respectively. E and G, shown is a light microscopy of SF-9 cells incubated with parigidin-br1 labeled with FITC at 3 h and 24 h, respectively. F and H, shown is a fluorescence microscopy of SF-9 cells incubated with parigidin-br1 labeled with FITC at 3 h and 24 h, respectively. I and K, shown is a light microscopy of SF-9 cells incubated with parigidin-br1 at 3 h and 24 h, respectively. J and L, shown is a fluorescence microscopy of SF-9 cells incubated with parigidin-br1 at 3 h and 24 h, respectively.

