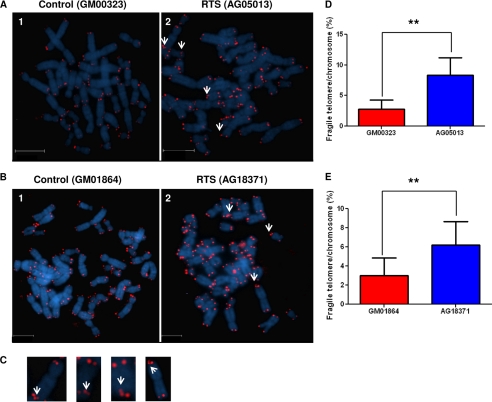
FIGURE 1.
Fragile telomeric ends in RTS patient cells. A and B, microscopic images showing representative metaphase spreads from control cell GM00323 (panel 1) and RTS cell AG05013 (panel 2) (A) and control cell GM01864 (panel 1) and RTS cell AG18371 (panel 2) (B). DAPI (blue) was used for nuclear staining, and the red dots represent the telomeric ends. Some of the fragile telomeres are shown by white arrows. Scale bar represents 95 μm for A and 75 μm for B. C, representative images of chromosomes containing fragile telomeres. Fragile telomeric ends are shown by white arrows. D and E, percent fragile telomeres/chromosome in sex- and age-matched M00323 and AG05013 cells (D) and GM01864 and AG18371 cells (E). The differences in occurrence of fragile telomeres between control and RTS cells are statistically significant (p = 0.006 (D) and p = 0.004 (E); n = 50). The error bars represent mean ± S.D.

