FIGURE 3.
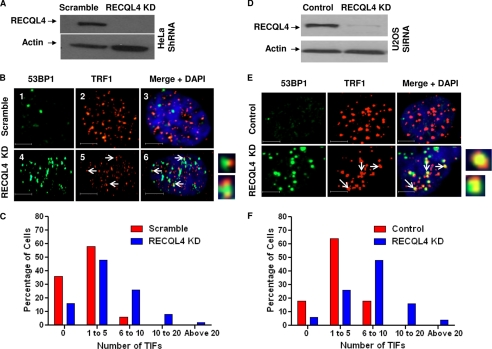
Telomeric 53BP1 foci in RECQL4 knockdown HeLa and U2OS cells. A, Western blot showing the level of RECQL4 in scrambled shRNA-treated (Scramble) and RECQL4-targeted shRNA-treated (RECQL4 KD) HeLa cells. Bands corresponding to RECQL4 and actin are shown by arrows. B, confocal microscopic images showing colocalization of 53BP1 foci (green) and TRF1 (red) signals in scrambled (panels 1–3) and RECQL4 KD HeLa cells (panels 4–6). Nuclear staining with DAPI is shown in the merged image. Some of the colocalized foci are marked with white arrows. Close-up images of some of the colocalized foci are shown next to panel 6. Scale bar = 5 μm. C, histograms showing the frequency distribution of telomeric 53BP1 foci (TIF) in scrambled and RECQL4 KD HeLa cells (n = 70). D, Western blot showing the level of RECQL4 in control siRNA-treated (Control) and RECQL4-targeted siRNA-treated (RECQL4 KD) U2OS cells. Bands corresponding to RECQL4 and actin are shown by arrows. E, confocal microscopic images showing colocalization of 53BP1 foci (green) and TRF1 (red) signals in control (panels 1–3) and RECQL4 KD U2OS cells (panels 4–6). Nuclear staining with DAPI is shown in the merged image. Some of the colocalized foci are marked with white arrows. Close-up images of some of the colocalized foci are shown next to panel 6. Scale bar = 5 μm. F, histograms showing the frequency distribution of telomeric 53BP1 foci in control and RECQL4 KD U2OS cells (n = 70).

