FIGURE 5.
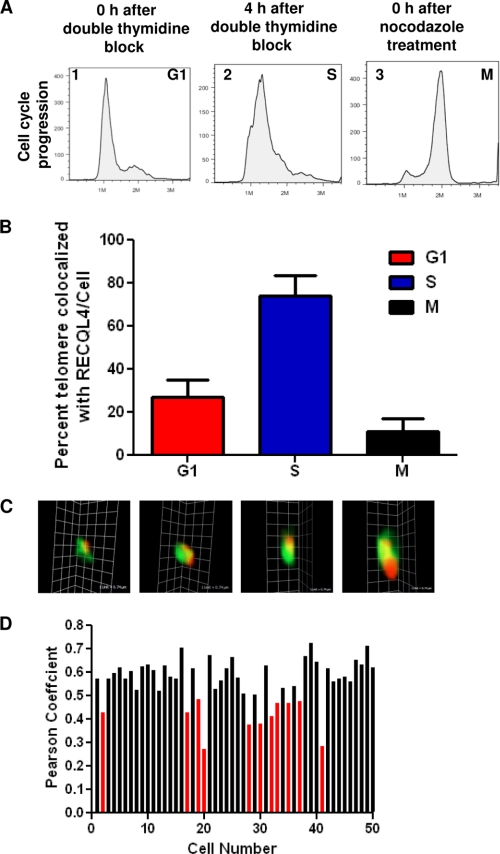
RECQL4 localizes at telomere. A, FACS analysis showing cell cycle progression states of U2OS cells immediately after double thymidine block (panel 1, G1), 4 h after double thymidine block (panel 2, S), and immediately after nocodazole treatment (panel 3, M). B, histograms showing the percentage of telomeric foci colocalized with RECQL4 at G1, S, and M phases. The error bars represent mean ± S.D., n = 50. C, three-dimensional images of four representative colocalized RECQL4 (green) and TRF1 (red) foci. Scale bar = 0.74 μm. D, histogram showing Pearson's correlation coefficients of 50 randomly selected S phase cells.

