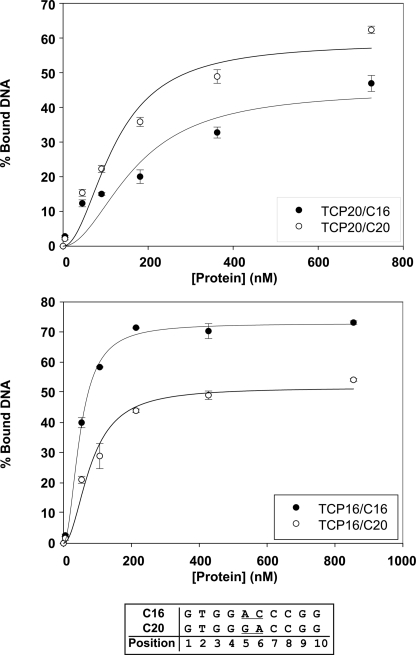
FIGURE 2.
TCP16 and TCP20 show different sequence preferences. Binding of different amounts of TCP20 (upper) and TCP16 (lower) to oligonucleotides carrying the sequences GTGGACCCGG (C16; black symbols) or GTGGGACCGG (C20; white symbols) was analyzed in EMSAs. The amount of bound DNA was calculated from signal intensities obtained with phosphor storage technology. The data are mean (±S.D.) of three independent experiments.

