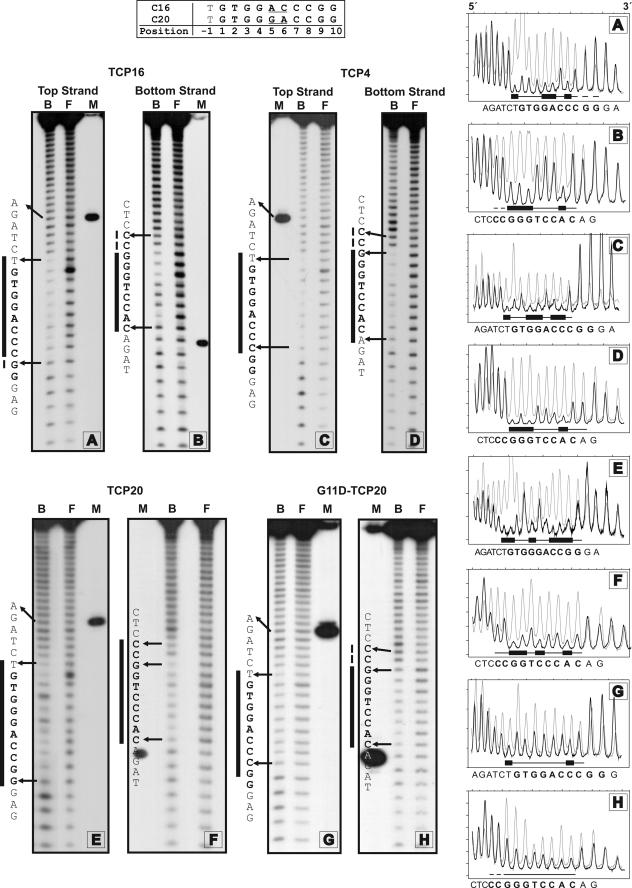
FIGURE 5.
Hydroxyl radical footprinting patterns of the complexes of TCP16, TCP4, TCP20, and G11D-TCP20 with their DNA target sites. C16 or C20 was labeled in the 3′ end of one strand (either top or bottom strand, named arbitrarily). After binding of the respective proteins, the DNA was subjected to hydroxyl radical attack. Free (F) and bound (B) DNA were separated and analyzed. The same fragment digested with restriction enzymes was used to calculate the position of the footprint (M). Letters beside each panel indicate the DNA sequence of the corresponding strand (5′ end in the upper part). Vertical bars indicate the region protected from the attack after protein binding. Densitometric scans of the lanes corresponding to free (gray line) and bound (black line) DNA are shown on the right.

