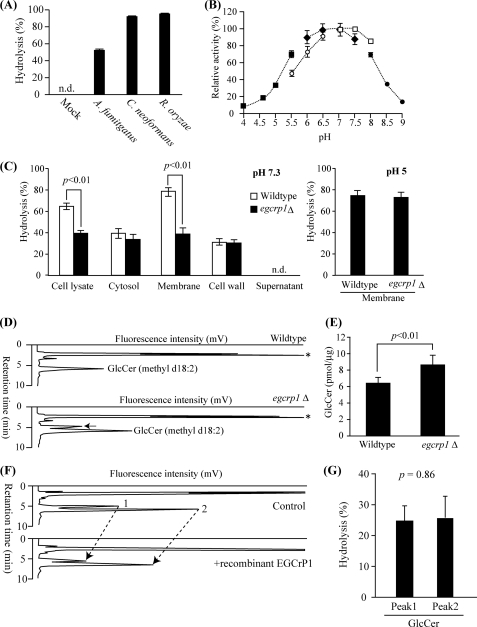
FIGURE 5.
Characterization of egcrp1 deletion mutants of C. neoformans. A, hydrolysis of NBD-GlcCer by cell lysate of E. coli transformed with pCold-TF (mock) harboring egcrp1 from A. fumigatus, C. neoformans, or R. oryzae. The enzyme assay was carried out as described in the legend of Fig. 2. n.d., products were not detectable. B, pH dependence of the recombinant EGCrP1 of C. neoformans. Fifty micromolar sodium acetate buffer (pH 4–5.5, closed squares), MES (pH 5.5–6.5, open circles), sodium phosphate buffer (pH 6–7.5, closed diamonds), HEPES (pH 7–8, open squares), and boric acid buffer (pH 8–9, closed circles) were used. C, hydrolysis of NBD-GlcCer at pH 7.3 by the cell lysate and cytosolic, membranous, cell wall, and supernatant fractions (left panel) and at pH 5.0 by the membranous fraction (right panel). D, HPLC-based quantification of GlcCer. GlcCer fractions were labeled with OPA and analyzed by normal phase HPLC (38). A black arrow shows the peak that emerged in only egcrp1Δ. An asterisk shows the OPA left after the reaction. E, amounts of fungus-specific GlcCer (methyl d18:2). F, HPLC showing the hydrolysis of fungus-specific mature (peak 2) and immature (peak 1) GlcCer by recombinant EGCrP1. G, extent of hydrolysis estimated from F. Error bars represent the mean ± S.D. of at least three experiments.

