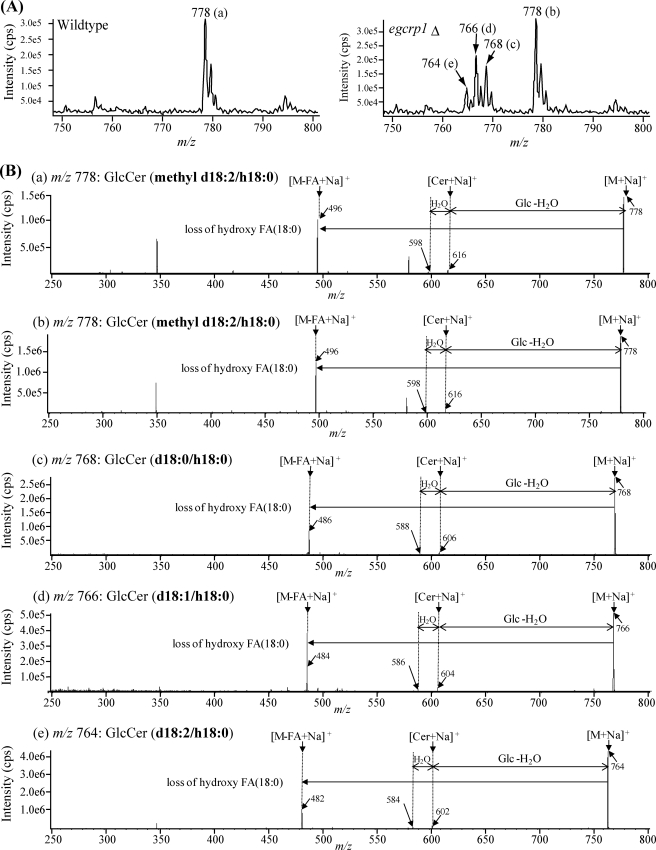
FIGURE 6.
Structural analysis of GlcCer accumulated in egcrp1Δ strains. A, MS spectra of GlcCer isolated from the wild type (left panel) and egcrp1Δ (right panel). Each peak (a, b, c, d, and e) was further subjected to MS/MS. B, MS/MS spectra of GlcCer containing different sphingoid bases (methyl d18:2, d18:0, d18:1, and d18:2) and α-hydroxy 18:0 fatty acid (h18:0). FA, fatty acid.

