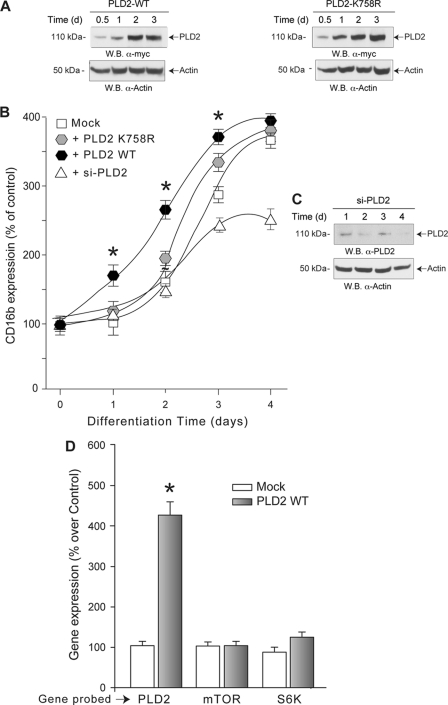
FIGURE 5.
PLD2 overexpression induces and accelerates differentiation of HL-60 cells. HL-60 cells in suspension were mock-transfected (only transfection reagents and no vectors) or transfected with plasmids encoding for fully active or inactive PLD2 proteins (PLD2 WT or PLD2 K758R, respectively). Immediately after transfection, mock- and PLD2-transfected HL-60 cells were induced to differentiate in fresh media containing 1.25% DMSO. A, Western blot (W.B.) of the effect of recombinant PLD2-WT (left) and -K758R (right) overexpression as a function of increasing time. The top panel represents recombinant PLD2 protein levels using a mouse anti-Myc monoclonal IgG antibody; the middle panel represents total (endogenous + recombinant) PLD2 protein levels using a mouse anti-PLD2 monoclonal IgG antibody, and the bottom panel is the equal loading control that shows approximately equal amount of protein in the lysates used for electrophoresis as ascertained with rabbit anti-actin IgG antibodies. B, total RNA for CD16b transcript quantification by qRT-PCR was obtained at each indicated time point. Results are the mean ± S.E. from three independent experiments conducted in duplicate. CD16b transcript expression levels at each time point of treatment with DMSO are expressed as % increase with respect to transcript levels obtained at time 0. The symbols denote statistically significant (p < 0.05) differences between PLD2-WT, PLD2-K758R, si-PLD2, and mock-transfected cells. C, silencing of PLD2 protein expression following treatment with si-RNA specific for PLD2. The top panel represents endogenous PLD2 protein levels, respectively, and the bottom panel is the equal loading control that shows approximately equal amounts of protein in the lysates used for electrophoresis, as ascertained with rabbit anti-actin monoclonal IgG antibodies. D, transcript levels of PLD2, mTOR, and S6K in HL-60 cells transfected with PLD2 WT. Transcript expression levels after 4 days of treatment with DMSO are expressed as % increase with respect to mock-transfected cells.

