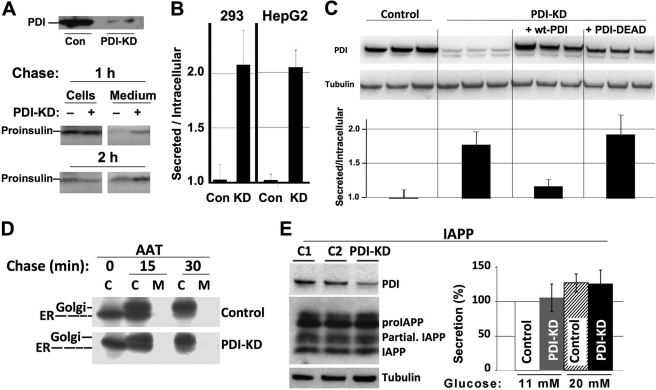
FIGURE 2.
PDI-KD effects on enhanced ER export are selective for proinsulin as substrate. A, at 48 h after transfection with either scrambled (Con) or PDI siRNA duplexes (100 nm), 293 cells were pulse-labeled for 30 min with [35S]Cys/Met and chased for 1 or 2 h; chase medium was then collected, and cells were lysed. Proinsulin was immunoprecipitated with anti-insulin and analyzed by Tris-Tricine-urea-SDS-PAGE under reducing conditions. Upper panel: Western blotting of PDI in the cells used in this experiment. B, at 48 h after transfection with either scrambled (Con) or PDI siRNA duplexes (KD), the media bathing either 293 cells or HepG2 cells as indicated were changed, and fresh media were collected between 48 and 72 h. At that time, the cells were lysed, proinsulin contained in both media and cell lysates was measured by RIA, and the extracellular/intracellular ratio of proinsulin was reported. The data are the mean of three experiments with six independent replicates; control ratio was set to 1.0. Control versus PDI-KD cells: p < 0.05 for both sets of cells. C, PDI-KD 293 cells were transfected to express empty vector, WT-PDI, or PDI-AGHA,AGHA′ (PDI-DEAD), and these lanes all compared with control cells that did not have PDI knockdown (triplicates at left). Upper panel: Western blotting of PDI in the cells used in this experiment. Lower panel: analysis by insulin RIA identical to that shown in panel B. Each experiment was performed in triplicate and repeated twice (six independent replicates); control ratio was set to 1.0. Control versus PDI-KD cells or PDI-KD cells expressing PDI-DEAD: p < 0.05. The difference between control and PDI-KD cells expressing WT-PDI was not statistically significant. C, cell lysates; M, media. D, INS1 cells were transfected to express AAT. The cells were then split and treated with either scrambled or PDI siRNA duplexes (40 nm, PDI knockdown was confirmed by Western blotting (not shown)). The cells were pulse-labeled for 20 min with [35S]Cys/Met and chased for the times indicated; media were collected, and cells were lysed as in Fig. 1C. The samples were immunoprecipitated with anti-AAT and analyzed by SDS-PAGE. ER exit of AAT was evaluated by the change in gel migration from the ER-glycosylated form of AAT to the Golgi-glycosylated form, as indicated. E, INS1 cells treated with siRNAs duplexes (100 nm) designed for knockdown of luciferase mRNA (C1), GFP mRNA (C2), or PDI-KD exactly as in Fig. 1B, for 72 h. Left panel: Western blotting for the antigens indicated, normalized to protein (10 μg), with γ-tubulin serving as a loading control. proIAPP, IAPP precursor; Partial IAPP, partially processed IAPP. The result is representative of three independent experiments. Right panel: INS1 cells transfected with siRNAs (100 nm) were grown for 3 days in RPMI media at lower (11 mm) or higher (20 mm) glucose. The media were collected, and IAPP secretion was analyzed by ELISA (see “Experimental Procedures”). The differences from control versus PDI-KD cells at either glucose concentration were not statistically significant.

