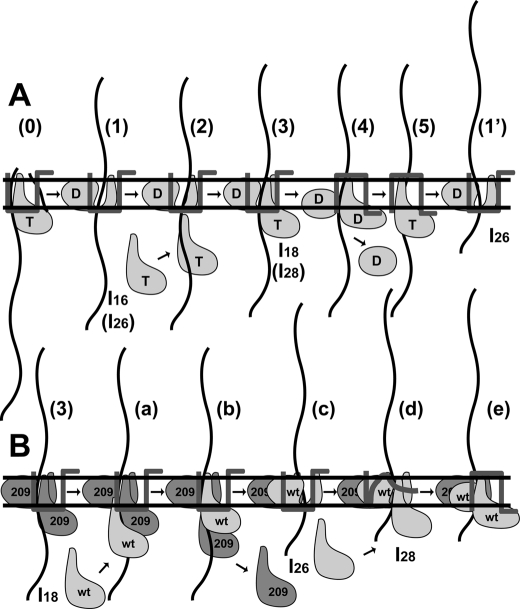
FIGURE 6.
Working model for proOmpA translocation. A, WT SecA, SecG with its topology, and (pro)OmpA (waved line) are shown. T and D represent ATP and ADP, respectively. At step 0, cleavage of the signal sequence is shown. The extent of translocation (steps 1–5 and 1′) is reflected by intermediate species (I16, I18, I26, and I28). B, model for the reaction involving D209N SecA. The mutant and wild-type SecA are indicated as 209 and WT. For details, see “Discussion.”

