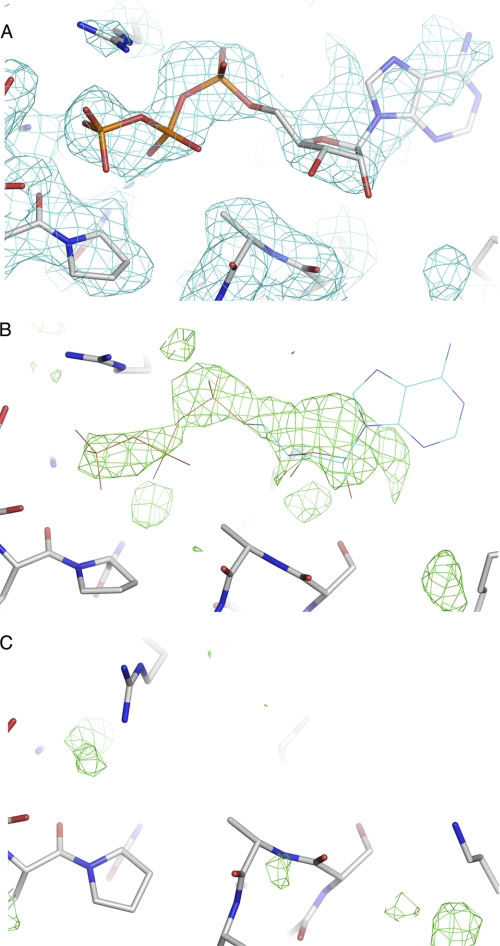
FIGURE 1.
ATP density. A, SIGMAA weighted 2Fo − Fc electron density map (blue) in the region of the ATP-binding site is displayed at 0.8 of the root mean square deviation of the map. The final model is shown in a stick representation. B, difference electron density (Fo − Fc) used for initial placement of ATP. The density (displayed with a cutoff of 2.3 times the root mean square deviation of the map) was phased from the IDE model after molecular replacement and initial refinement. The final ATP model is shown in a line representation. C, simulated annealing omit difference electron density (Fo − Fc, 2.3 times the root mean square deviation of the map) in the region of the ATP-binding site from an IDE crystal structure determined in the absence of ATP (19). Crystallization and data collection conditions were the same as used for the ATP-bound structure except ATP and EDTA were not included in the final soaking solution.

