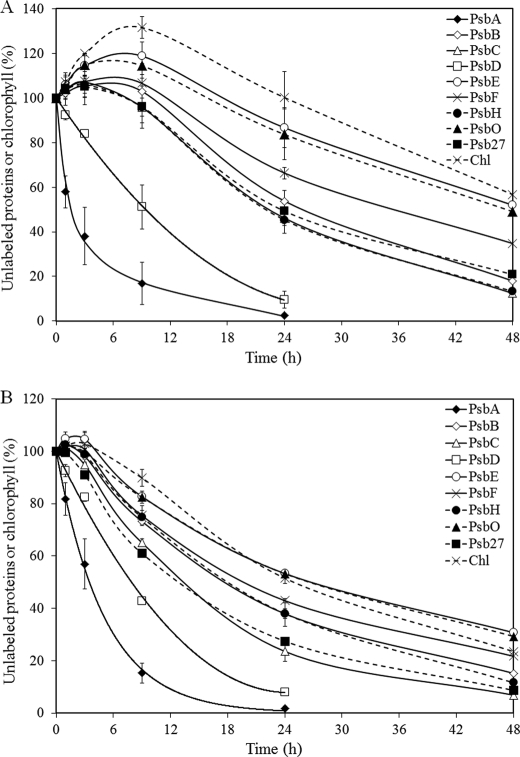
FIGURE 3.
Turnover of PSII components from PSI-less (A) and PSI-less/SCP-less (B) cells that were harvested in post-exponential growth phase (OD730∼ 0.9). The amount of unlabeled proteins and chlorophyll in these strains was followed during a 48-h period after the start of 15N labeling. 100% indicates the amount present at the start of labeling. PsbA, ♦ with solid line; PsbB, ♢ with solid line; PsbC, △ with solid line; PsbD, □ with solid line; PsbE, ○ with solid line; PsbF, × with solid line; PsbH, ● with dashed line; PsbO, ▴ with dashed line; Psb27, ■ with dashed line; and chlorophyll (Chl),: × with dashed line. Numbers on the y axis represent the percentage of unlabeled proteins/chlorophyll relative to time 0. Shown are the average results of two independent experiments ± S.D.

