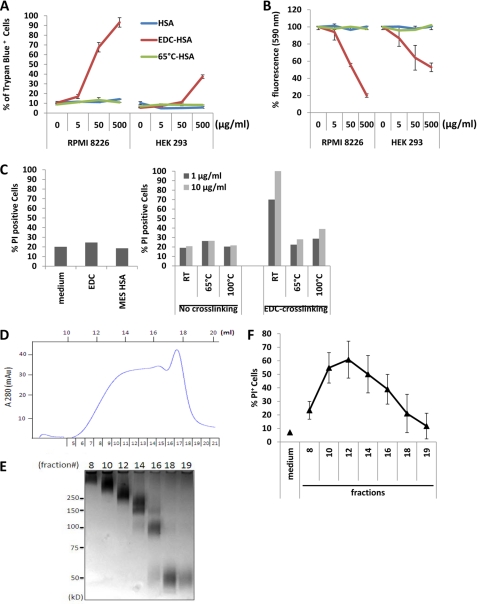
FIGURE 1.
EDC-crosslinked HSA displays cytotoxicity. A, RPMI 8226 and HEK 293 cells were cultured with different concentrations of HSA, EDC-crosslinked HSA (EDC-HSA), or 65°C-aggregated HSA. Assessment of cell death was performed by staining cells with Trypan Blue and examination under the microscope. Error bars are means ± S.D. B, assessment of cell viability with CellTiter-Blue® agent. The fluorescence at 590 nm emitted by cells cultured in medium alone with CellTiter-Blue® was used as reference (100%). Relative fluorescence emitted by cells under other conditions was calculated and plotted accordingly. C, quantification of dead cell populations in RPMI 8226 cells cultured for 24 h with medium, EDC or HSA in MES buffer was performed by PI staining (left). PI staining was also performed on RPMI 8226 cells cultured with 1 or 10 μg/ml of different forms of HSA with or without EDC crosslinking (right). D, chromatograph of size-exclusion separation of EDC-crosslinked HSA. The fraction numbers and elution volume are shown in relation to the 280 nm optical density (OD) reading. E, fractions obtained by size-exclusion chromatography were separated by SDS-PAGE. The corresponding fraction numbers are marked on the top. Also noted are the positions of molecular weight markers. F, dead cell populations in RPMI 8226 cells cultured with individual fractions from size-exclusion chromatography (1 μg/ml) was assayed by PI staining. Error bars are means ± S.D.

