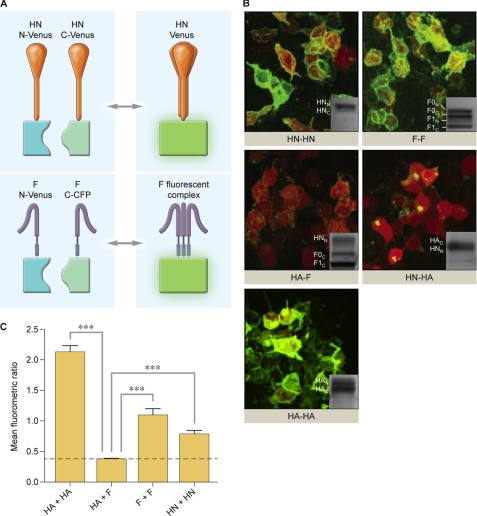
FIGURE 3.
Oligomerization of HPIV3 HN and F and control viral glycoproteins visualized by BiFC. A, shown is a schematic diagram of HN-HN and F-F oligomerization observed by BiFC. Upon interaction and oligomerization of monomers of HN or F, the halves of YFP-Venus complement to produce fluorescence. HN is tetrameric, and F is trimeric. B, 293T cells co-transfected with constructs encoding either HN N-Venus (HNN) and HN C-Venus (HNC), F N-Venus (FN) and F C-CFP (FC), HA N-Venus (HAN) and HA C-Venus (HAC), HA N-Venus and F C-CFP, or HN N-Venus and HA C-Venus. Receptor engagement is prevented by the addition of 10 mm zanamivir. These experiments were subjected to immunoblot analysis, shown as insets in each image, to confirm equal expression across all samples. Proteins are detected by goat anti-GFP HRP antibody. C, shown is the mean fluorometric ratio resulting from protein-protein interaction observed in panel B, measured in an average of at least three fields per experiment. The data are results from seven experiments, each with at least triplicate readings. Means with S.E. are reported. ***, p < 0.001 (one-way analysis of variance).

