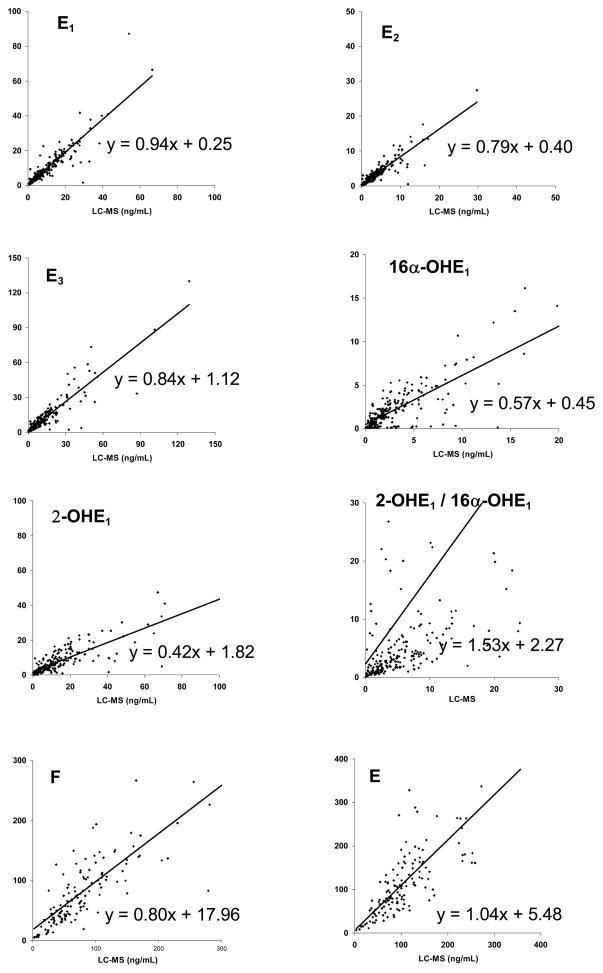
Fig. 2. LCMS-GCMS correlations.
Linear regression data for the urinary concentrations measured by LCMS and GCMS of estrone (E1), estradiol (E2), estriol(E3), 16α-hydroxyestrone (16α-OHE1), 2-hydroxyestrone (2-OHE1), the ratio of 2-hydroxyestrone to 16α-hydroxyestrone (2-OHE1/16α-OHE1), cortisol(F), and cortisone (E). All quantitations applied adjustments for internal standards but the latter were not identical for all analytes (see Methods for details)

