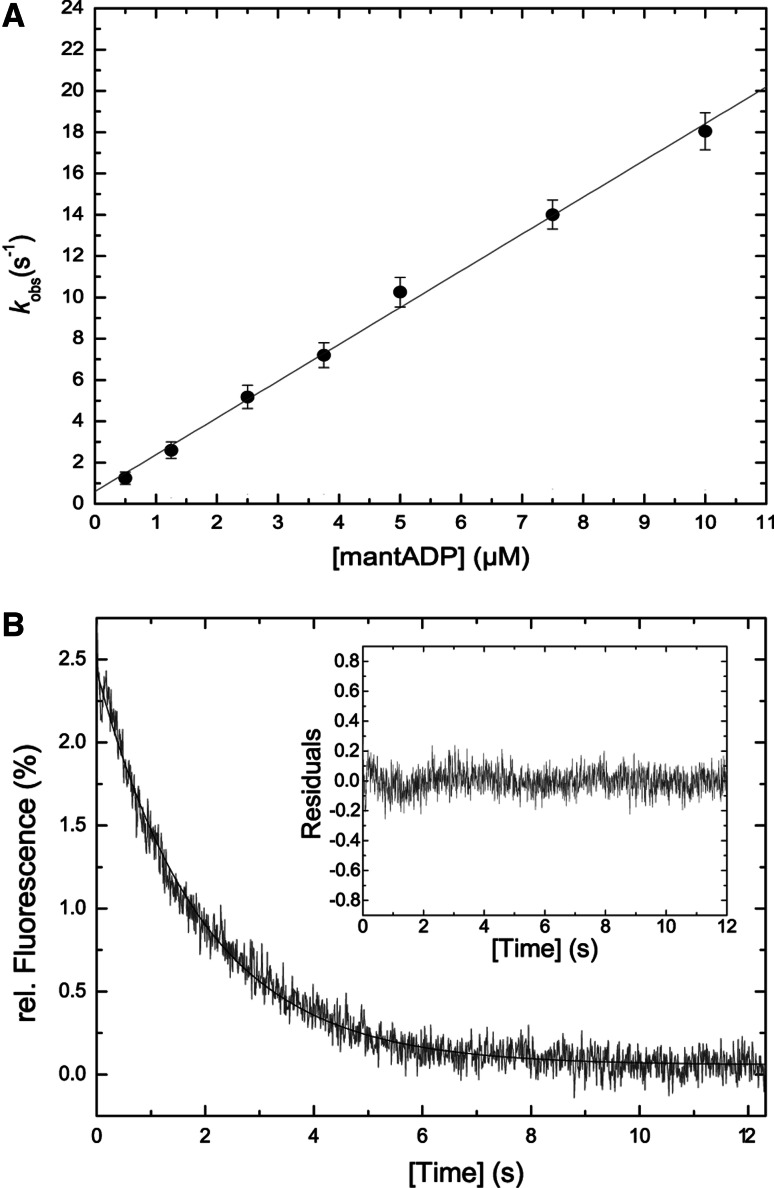
Fig. 5.
ADP interaction of acto•M7a. a ADP binding to acto•M7a. Linear approximation of the data set gives the second order rate constant of mantADP binding to actomyosin-7a k +AD = 1.78 ± 0.04 μM−1 s−1. The corresponding intercept defines k -AD = 0.59 ± 0.03 s−1. Error bars represent standard deviations from at least three determinations of each data point. b ADP dissociation from acto•M7a. Displacement of ADP (1 μM) from 0.25 μM acto•M7a with excess ATP (1,000 μM). Single exponential approximation of the decrease in light scattering signal gives k −AD = 0.48 ± 0.01 s−1. The corresponding residual plot (inset) comprises the same time axes as the data fit

