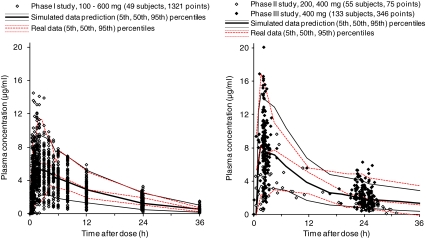
Fig. 1.
Plasma garenoxacin concentration versus time profile. Plotted symbols show the observed concentration data, and the lines show the results of visual predictive checks. For simulated data, the 5th, 50th, and 95th percentiles (from bottom to top) of the final model simulated data are displayed; for real data, the 5th, 50th, and 95th percentiles (from bottom to top) of the observed concentrations are displayed. These percentiles were set for the 400 mg dose, which is clinical standard dose

