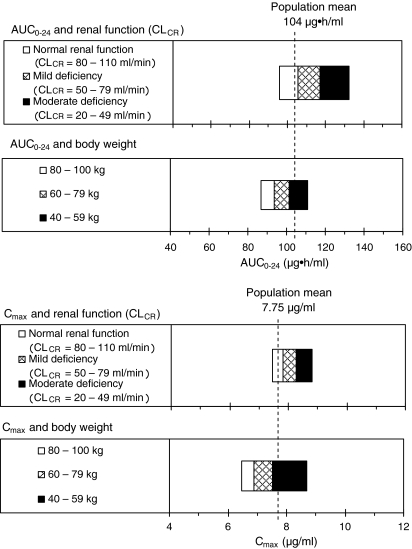
Fig. 2.
Influence of the covariates (renal function and body weight) on the plasma concentration–time curve from 0 to 24 h (AUC 0−24) and peak plasma concentration (C max). Exposure values (AUC0−24 and Cmax) were simulated by the population mean parameters of the final model using the characteristics of 237 subjects. The simulation was made by varying one covariate within the particular range while all other covariates were kept at their mean value. CL CR Creatinine clearance

