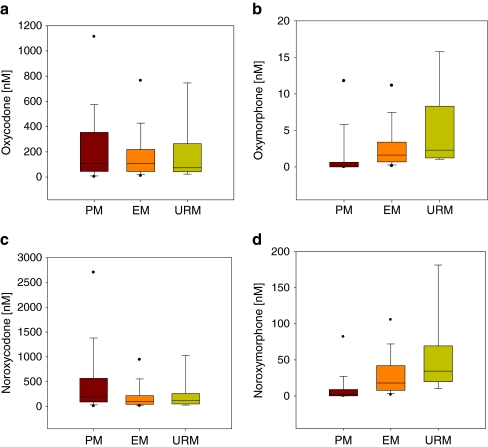
Fig. 2.
Box and whisker plots of median serum concentrations (nMolar) of a oxycodone, b oxymorphone, c noroxycodone and d noroxymorphone with 25th and 75th percentiles between the three genetic groups poor metabolisers (PM, n = 27), extensive metabolisers (EM, n = 413) and ultra-rapid metabolisers (URM, n = 10). The whiskers represent the 5th and 95th percentile

