Fig. 6.

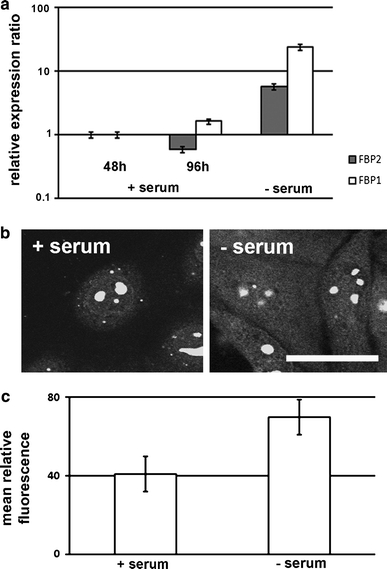
Correlation between expression of FBPase isozymes and the KLN-205 cell culture growth. a qPCR analysis of the expression versus time of the culture growth. b FISH analysis of mRNA for FBP2 in quiescent cells (−serum) in comparison with the cells cultured in the presence of serum (+serum). Scale bar 25 μm. c The measurement of FISH signal from mRNA of FBPase in the cell culture with and without serum
