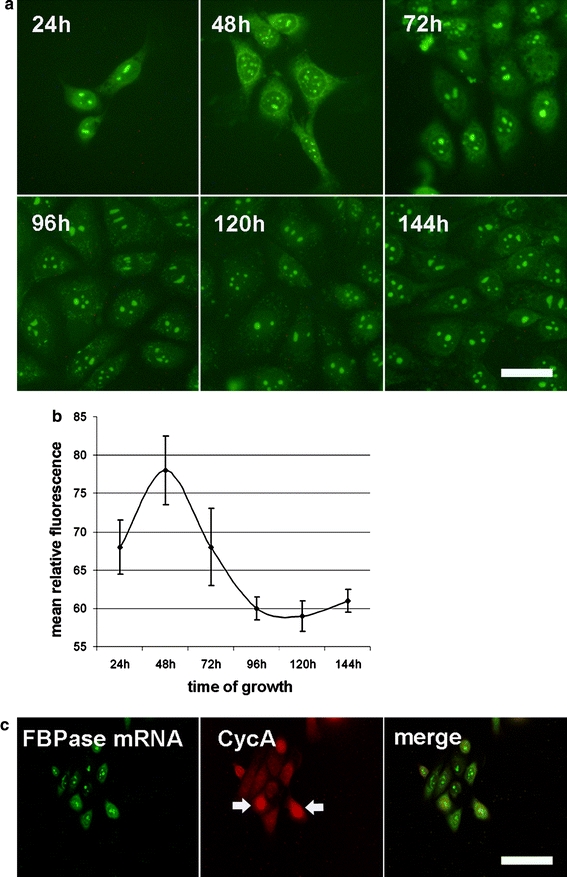
Fig. 7.

The dependence of expression of mRNA for muscle FBPase in the KLN-205 cells on the cell culture density and its correlation to the expression of S/G2 phases marker (CycA). a FISH signals related to mRNA for FBP2 observed in various time of the cell culture growth. Scale bar 25 μm. b Quantification of FISH signals as a function of cell density. c Double fluorescent labeling of the KLN-205 cells showing the correlation between the expression of mRNA for FBPase (FISH method) and the amount of CycA (immunofluorescent staining). Arrows indicate the KLN-205 cells with high amount of both CycA and mRNA for FBPase. Scale bar 40 μm
