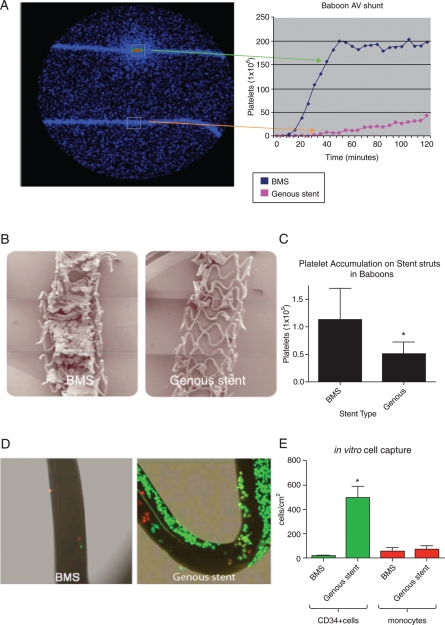
Figure 3.
Live imaging of arteriovenous shunt setup using a gamma camera to measure deposition of indium-labelled platelets on the study stents (A). Line graph shows a typical example of accumulating platelet signal over time. Low-magnification scanning electron microscope images of the bare-metal stent and the endothelial progenitor cell-capture stent in the baboon arteriovenous shunt model revealed a decrease in mural thrombus in the Genous vs. bare-metal stent (B). Bar graph showing the quantified number of platelets accumulated on the bare-metal stent and Genous stent after 2 h of flow exposure (C). Data were acquired from the live imaging of arteriovenous shunt setup, *P< 0.05, n = 3. In vitro assay to test the CD34+ cell-capture specificity of the Genous stent. Genous and BM stents were deployed in silicon tubing and were exposed to a cell mixture of PKH26 red fluorescent-labelled human monocytes (1 × 10⁶ cells/mL) and PKH2 green fluorescent-labelled human CD34+ cells (2 × 10⁵ cells/mL), under a constant rotation speed of 0.3 RPM for 2 h. Micrographs show confocal images of strut coverage of bare-metal stent and Genous stent (D). Bar graph shows the quantified number of CD34+ cells and monocytes per cm2 strut area. *P< 0.05, n = 3 (E).

