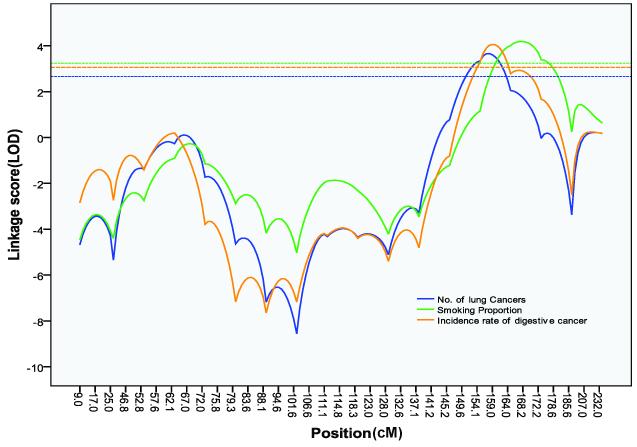
Figure 1.
OSA results on chromosome 6q. The blue curve represents OSA results using the largest number of affected individuals in the family; the green curve represents OSA results using the lowest proportion of smokers in the family; and the yellow curve represents OSA results using the smallest incidence rate of digestive cancer in the family. For each horizontal dash line, the part under the curve with the same color represents its corresponding1-LOD-unit support interval. Three intervals overlap over one region of 160.0-164.0 cM.

