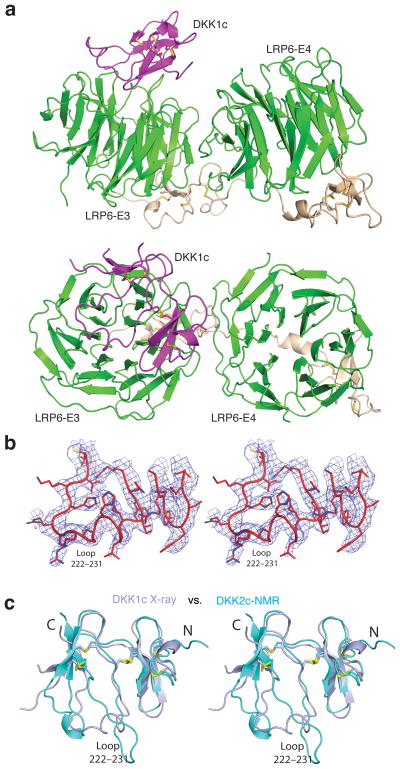
Figure 4.
Crystal structure of the LRP6-E3E4/DKK1c complex. (a) An overall view of the complex in two orientations roughly related by a horizontal 90° rotation. Only the interface A is shown here (see text). DKK1c is in magenta. (b) Stereo view of a representative portion of the Fo-Fc electron density map (contoured at 2.0 σ), showing the DKK1c loop 222–231 region. The map was calculated using phases from LRP6-E3E4 only. (c) Comparison of DKK1c and DKK2c structures. Crystal structure of DKK1 in the LRP6-E3E4/DKK1 complex (in light blue) and the NMR structure of DKK2c (in cyan) are superimposed.

