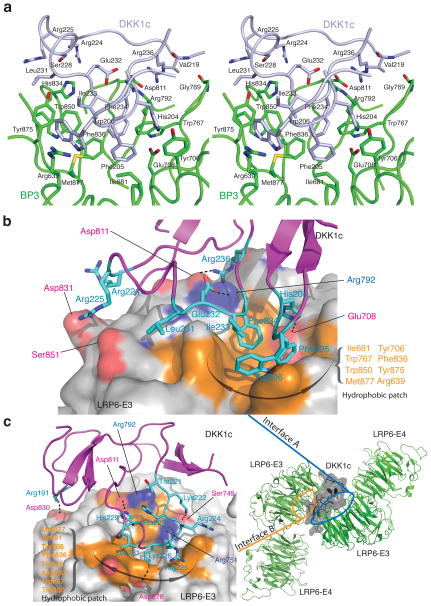
Figure 5.
Specific interactions in the two LRP6-E3/DKK1c interfaces. (a) Stereo view of LRP6-E3E4/DKK1 interface A. DKK1c is shown in light blue. Residues involved in the interactions are labeled and shown in green (LRP6-E3E4) and light blue (DKK1c) stick models. (b) A surface representation of the LRP6–DKK1c interaction (interface A only). LRP6-E3 is shown in surface illustration. LRP6 residues involved in the interface are shown on the solid surface, whereas DKK1 residues are shown in stick models. Hydrophobic LRP6 and DKK1c residues directly involved in hydrophobic interactions are also labeled in orange and cyan, respectively. (c) The second LRP6–DKK1 interface (interface B) observed in the crystal lattice. (Right) Overall structure of LRP6-E3E4/DKK1c complex in the crystal lattice. Two LRP6-E3E4 are arranged roughly in an anti-parallel orientation. DKK1c is shown in transparent surface illustration. (Left) Detailed interactions on the interface B. LRP6-E3 is shown in surface illustration and its interface residues are shown as in (b). The physiological relevance of the interface B remains to be tested.

