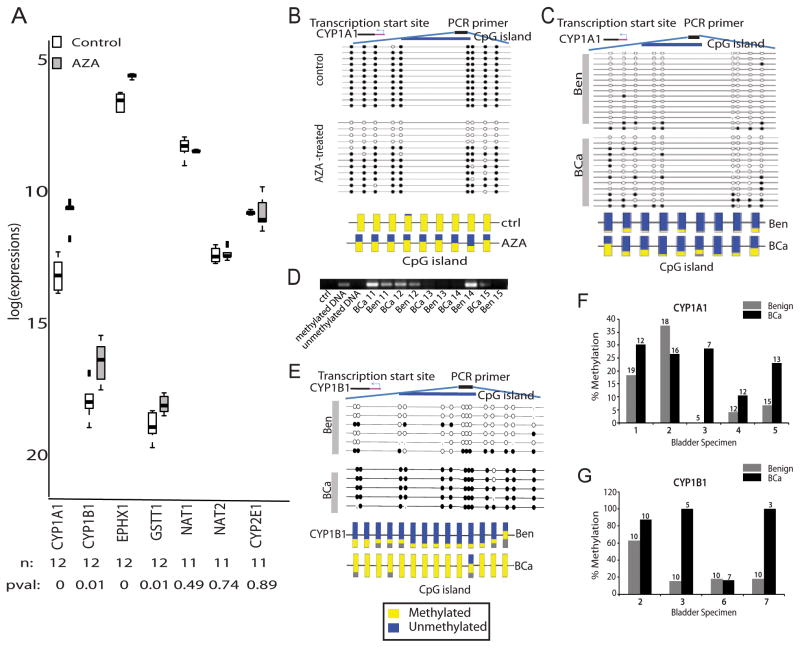
Figure 5. Methylation-induced Silencing of Phase I/II Metabolic Enzymes.
A. Box plots for real time PCR data showing relative transcript levels in T-24 BCa cells with and without treatment with 5 μm 5-aza-2′-deoxycytidine. n = number of samples; pval = p-value. B. Bisulfite sequencing of CYP1A1 in control and AZA-treated T24 BCa cells. Each row indicates the methylation profile for the nine CpG islands in an independent clone (top panel). Multiple clones were analyzed from the treated (n = 11) and untreated groups (n = 12). Filled circles indicate methylated cytosine and open circles denote the unmethylated residue (top panel). The bottom panel shows the average methylation profile for each CpG island. C. Same as B, but for CYP1A1 in BCa and matched benign adjacent tissue. D. Methylation-specific PCR showing higher CpG methylation in CYP1A1 promoter (product size = 127 bp) in matched BCa and benign adjacent tissues (n = 6 pairs). E. Same as B, but for CYP1B1 in BCa and matched benign adjacent tissue. Methylation profile of 14 CpG islands were examined. F. Plot summarizing the bisulfite sequence analysis results for CYP1A1 promoter in BCa and benign adjacent tissues. The median percentage methylation was calculated for each tissue using data obtained from all the sequenced clones. G. same as F, but for CYP1B1.

