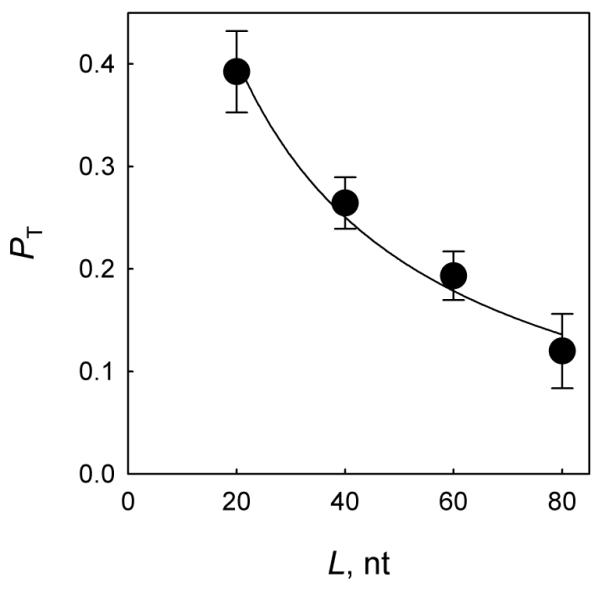
Fig. 4.

Dependence of the translocation component PT = Pcc/PE on the distance separating the cleavage sites. Mean ± SD of three independent experiments are shown. The curve is the fit of the experimental data to the function P = 0.5×(W(8, N + 8) + W(13, N + 13)) (see main text).
