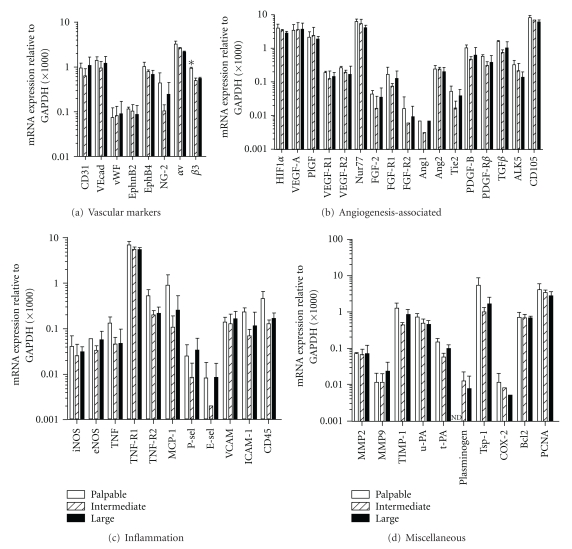
Figure 2.
In the three different stages of s.c. B16.F10 tumor growth, mRNA expression of the 46 genes under study is similar. Tumors were harvested at palpable, intermediate, and large volumes (early, intermediate and late stages). Values represent mRNA expression levels measured by qRT-PCR-based Low-Density Array and adjusted to GAPDH. Mean + SD; n = 3. Expression of FGF-2, FGFR2, Ang1, P-selectin, E-selectin, and COX-2 was additionally measured twice by manual qRT-PCR. PCNA was measured by manual real-time RT-PCR alone in duplicate. *P < 0.05. ND: not detectable.

