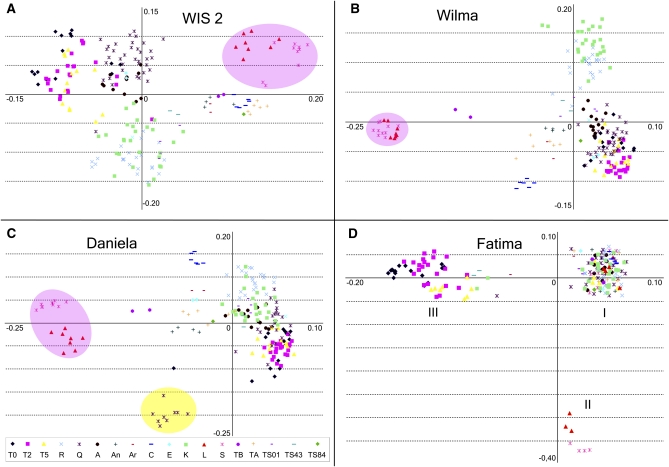
Figure 3.
Distribution of populations in the space of the two first principal components. PC1 is located on x-axes, and PC2 is on y-axes. The raw data for the PCA analysis consist of the appearances of each IRAP band in the individual genotypes. The PCA algorithm was singular value decomposition (SVD). The obvious clustering of populations in the space of the first two PCs (11.4% of total variance) is clearly observed. (A) WIS2 element IRAP pattern variability. (B) Wilma element IRAP pattern variability. (C) Daniela element IRAP pattern variability. Genotypes from the Kishon (Q) population with unusual IRAP patterns are shaded in yellow. (D) Fatima element IRAP pattern variability. Three groups are marked with Roman numerals. (A–C) Ae. sharonensis and Ae. longissima genotypes are shaded in pink.

