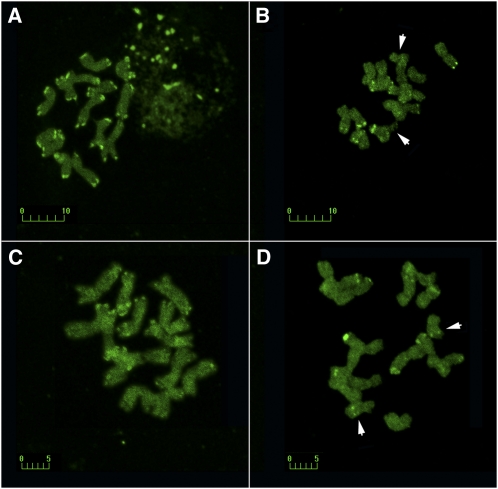
Figure 5.
Molecular cytogenetic display of transposable element diversity. (A–D) Comparison of FISH signals from the Ty1-copia (A and B) and Ty3-gypsy (C and D) LTR retrotransposons in genotypes of Ae. speltoides from contrasting populations: the central population from Latakia (TS84) (A and C) and the marginal Kishon (Q) population (B and D). The B chromosomes are arrowed. Bars: 10 μm and 5 μm.

