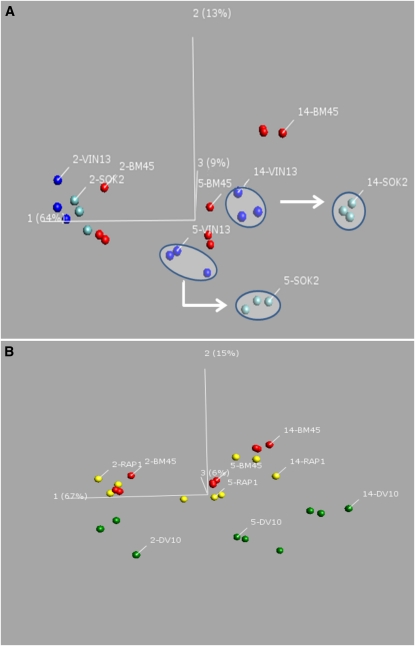
Figure 4 .
Principal component analysis of aroma compound concentrations in strains overexpressing individual transcription factors as compared to the corresponding untransformed parental as well as to the strain with naturally higher levels of expression of the same transcription factor. (A) A PC1 vs. PC2 vs. PC3 plot of the VIN13 SOK2-overexpression strain (light blue), the VIN13 control strain (dark blue), and the BM45 target strain (red). Component 1 accounts for 64%, component 2 for 13%, and component 3 for 9% of model variation. (B) The BM45 RAP1-overexpressing strain (yellow), control BM45 strain (red), and target DV10 strain (green) are shown. In this case component 1 accounts for 67% of model variation, component 2 for 15%, and component 3 for 6% of model variation. Samples are labeled according to timepoint (day 2, 5, or 14) and strain.

