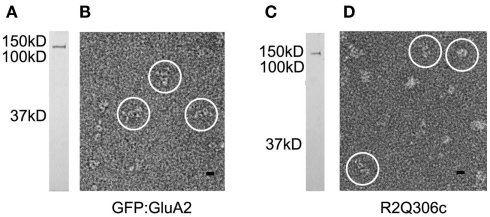
Figure 1.
Visualization of GluA2-fusion proteins. Receptors containing GFP:GluA2 (A,B) and R2Q306c (C,D) subunits were visualized by SDS-PAGE and silver stain (A,C), showing a single band of the expected relative molar mass (Mr) for each protein. Following negative staining (B,D), both receptors were visualized as bright, stain-excluding particles (circles) with features characteristic of GluA2 channels. Mr standards are shown to the left of each gel. Scale bar = 10 nm.

